Financial market technical analysis employs tools such as chart patterns, indicators, and trendlines to determine the best buying and selling opportunities based on volume and trading activity.
Trendlines provide traders with a better idea of where the financial markets, whether forex, crypto, or others, are headed by using visual representation and support and resistance techniques.
This trendline guide focuses on how to learn to draw trendlines, including upward trendlines, downward trendlines, and channels, as well as how to spot great opportunities as a trader using this simple but powerful technique.
Reasons To Use Trend Lines
A trendline is a charting tool used to determine the market's direction by connecting prices using support or resistance. A trendline can also be seen as a straight line that joins two or lower highs or higher highs.
Trendlines are used by most financial traders who need to be sure the market trend is in their favor. Traders also use trendlines effectively to know potential areas acting as support and resistance or if a particular trend has failed or has a broken market structure.
The trendline strategy is very effective and more advantageous to the traders that want to trade the financial market successfully. Here are some reasons why you should learn how to use trend lines.
Understanding Trend Lines (With Screenshots)
Haven discussed how important trendlines can be and how traders leverage this great tool to execute trades based on technical analysis; we would now focus on the different types of trend lines.
We will focus on the common trendlines traders employ to spot trading opportunities in the crypto markets: the uptrend line, the downtrend line, and the internal trend line.
Uptrend Line

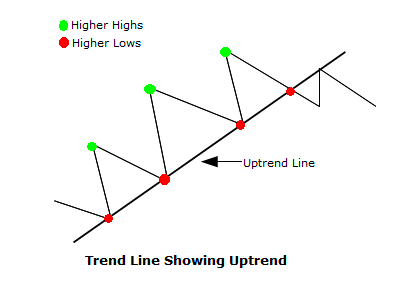
An uptrend line is formed by connecting two or higher lows or lows. This means the second low must be higher than the previous low before an uptrend can be considered valid. When lows or higher lows of more than three points, the uptrend is more valid and considered a trend line.
An uptrend acts as support with an increase in net demand as the price rises in an upward direction, an increasing uptrend with great demand at the trend line area is considered bullish. Usually, more demand for prices is found in this region.
In an uptrend, if prices respect the trend line and do not break the trendline acting as support, the uptrend is considered valid, but if the price breaks below the trend line, it is considered invalidated and signals a shift in trend is imminent.
Downtrend Line
A downtrend line is formed by connecting two or lower lows or swing high points. This means every swing high must be higher than the next swing high, and every swing low must be higher than the next swing low.
A downtrend line acts as resistance with so much increase in net supply as the price decreases. An increasing decline in price followed by increased supply confirms a highly bearish signal with more sellers than buyers in the market.
As the price respects the downtrend line, this indicates the downtrend is intact, but if the price breaks to the upside of the downtrend line, then it invalidates this setup, and a shift of the trend to the upside is imminent.
Internal Trend Lines
Internal trend lines are types of trendlines does not match up cleanly compared to the uptrend line and downtrend line we just discussed. The highs and lows could be distorted in points or angle steepness, and an extremely volatile market could require not touching some points.
Drawing this trendline depends not on the highs and lows but on the market's price action. Connecting the points in this type of trend is subjective because it requires time, an eye for this type of trend, and does not follow the rules of drawing the other traditional trendlines.
How To Drawing Your Own Trend lines Correctly
Now that we have a good understanding of what trendlines are, the different types, and how important they are to spot potential opportunities in the crypto market. Let us discuss how to draw trendlines correctly.
You must follow the rules of drawing correct trendlines to get the best results; otherwise, they will become an issue if not appropriately drawn.
When drawing trendlines, ensure it touches or more points, meaning it should tough swing lows or highs for better results.
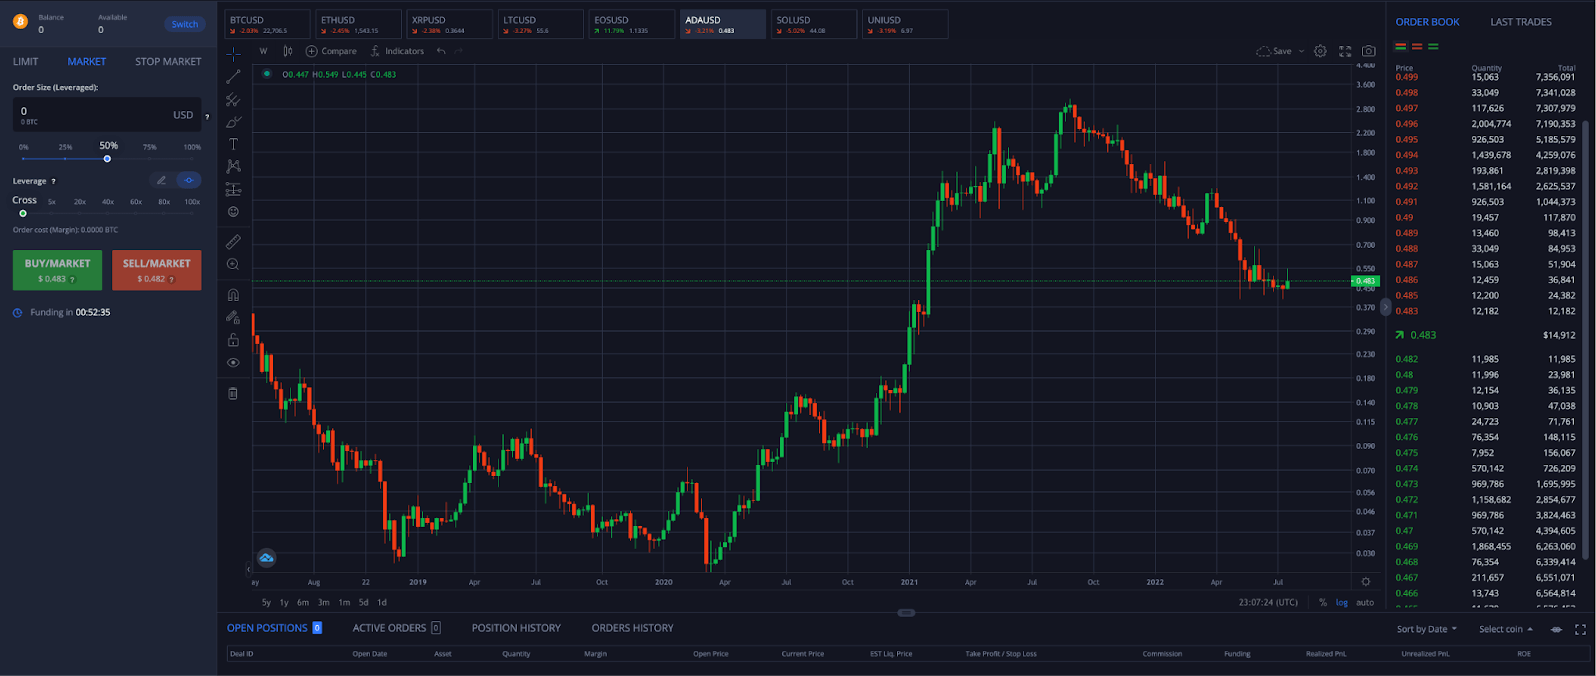
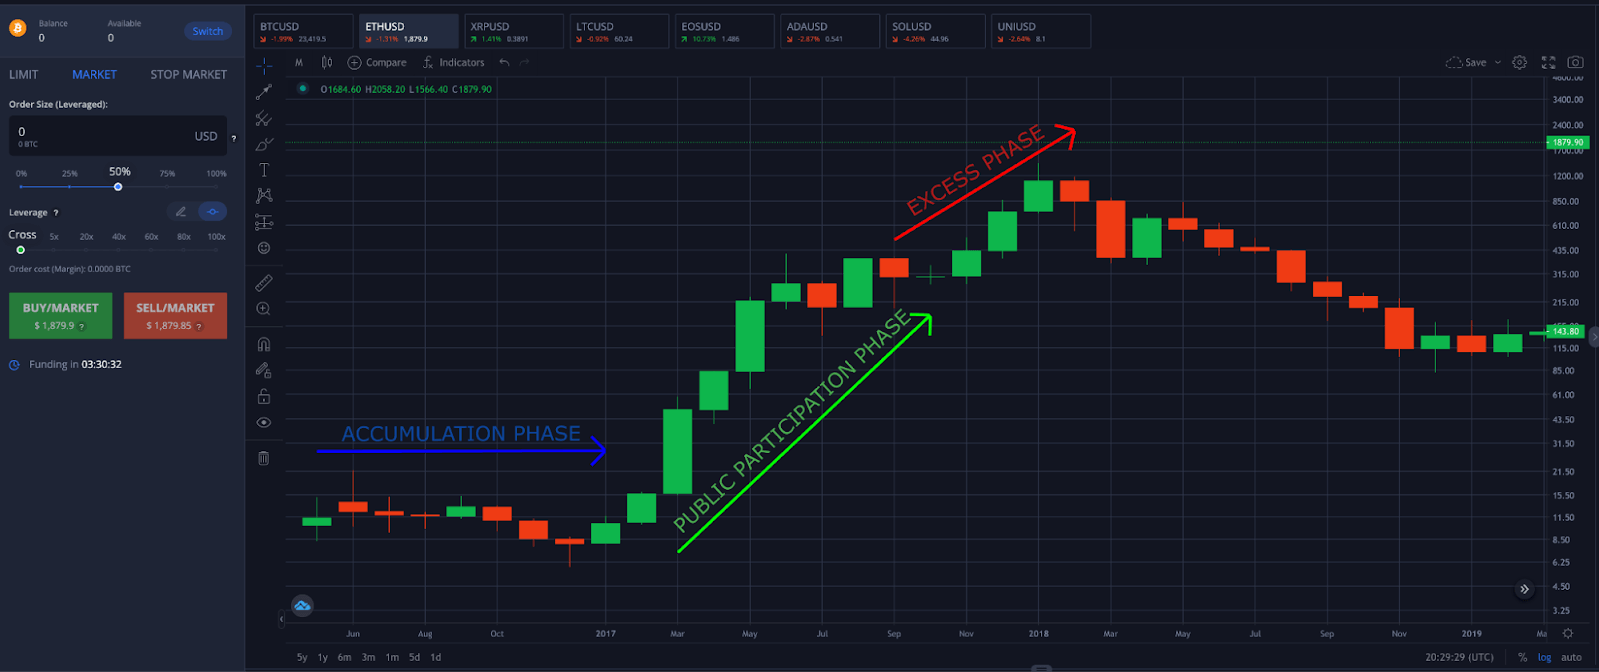
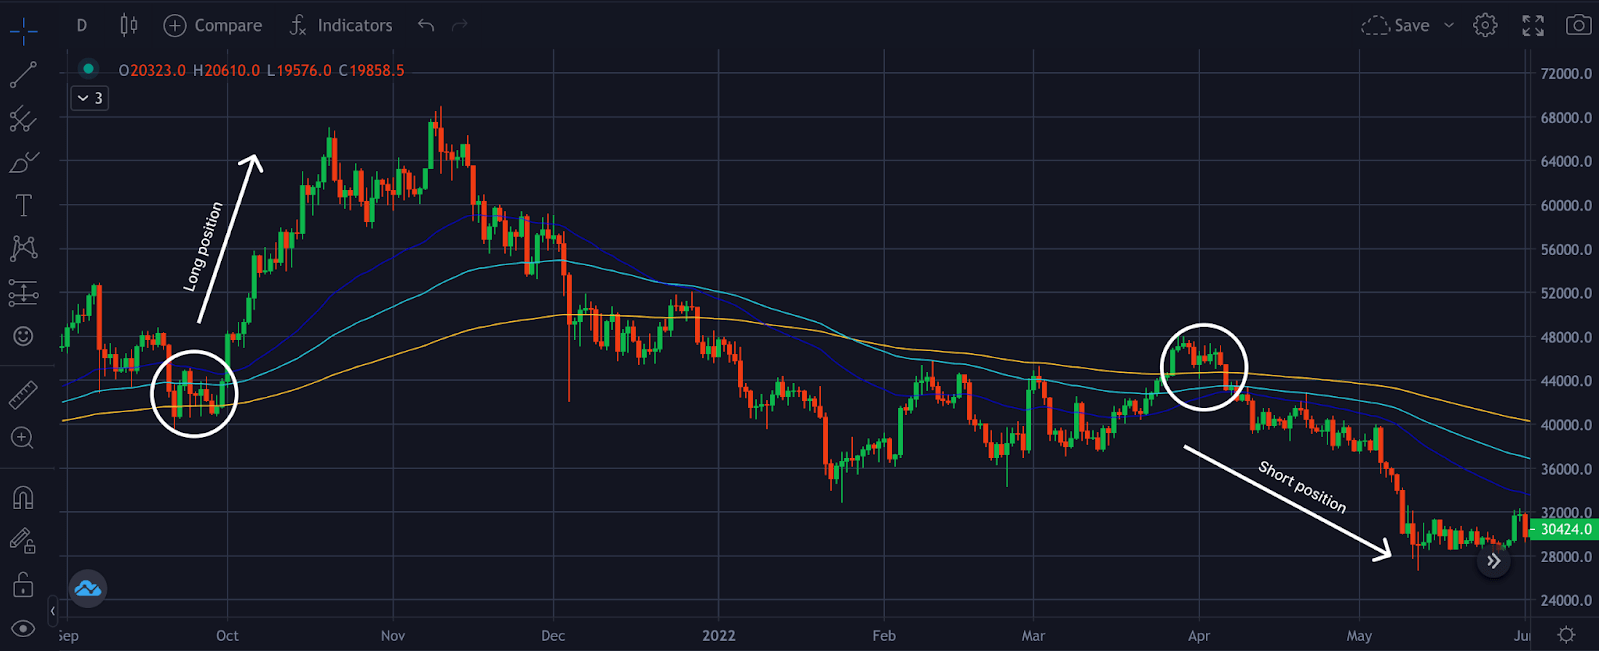
The chart above shows an uptrend line touching more than two points on the daily timeframe. The trendline is in an uptrend and acts as a good support area where bids for buys or long positions can be opened for better opportunities.
A trader can place bids close to the support areas to enter a position and stop loss would be put just a few distances away from the uptrend line in case of a trend reversal.
A break and close below the uptrend line indicate a potential reversal in the trend from bullish to a bearish trend.
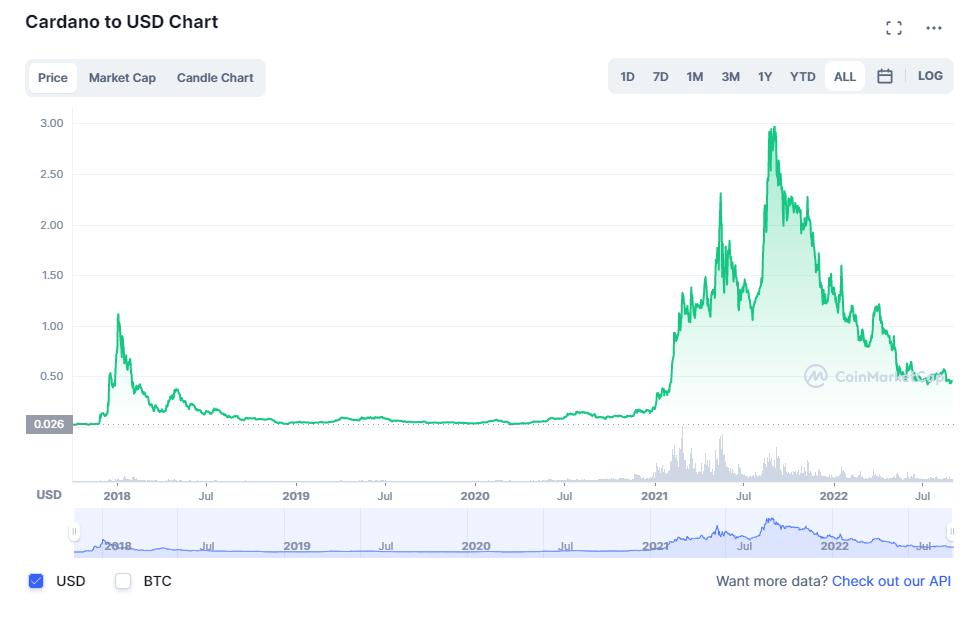
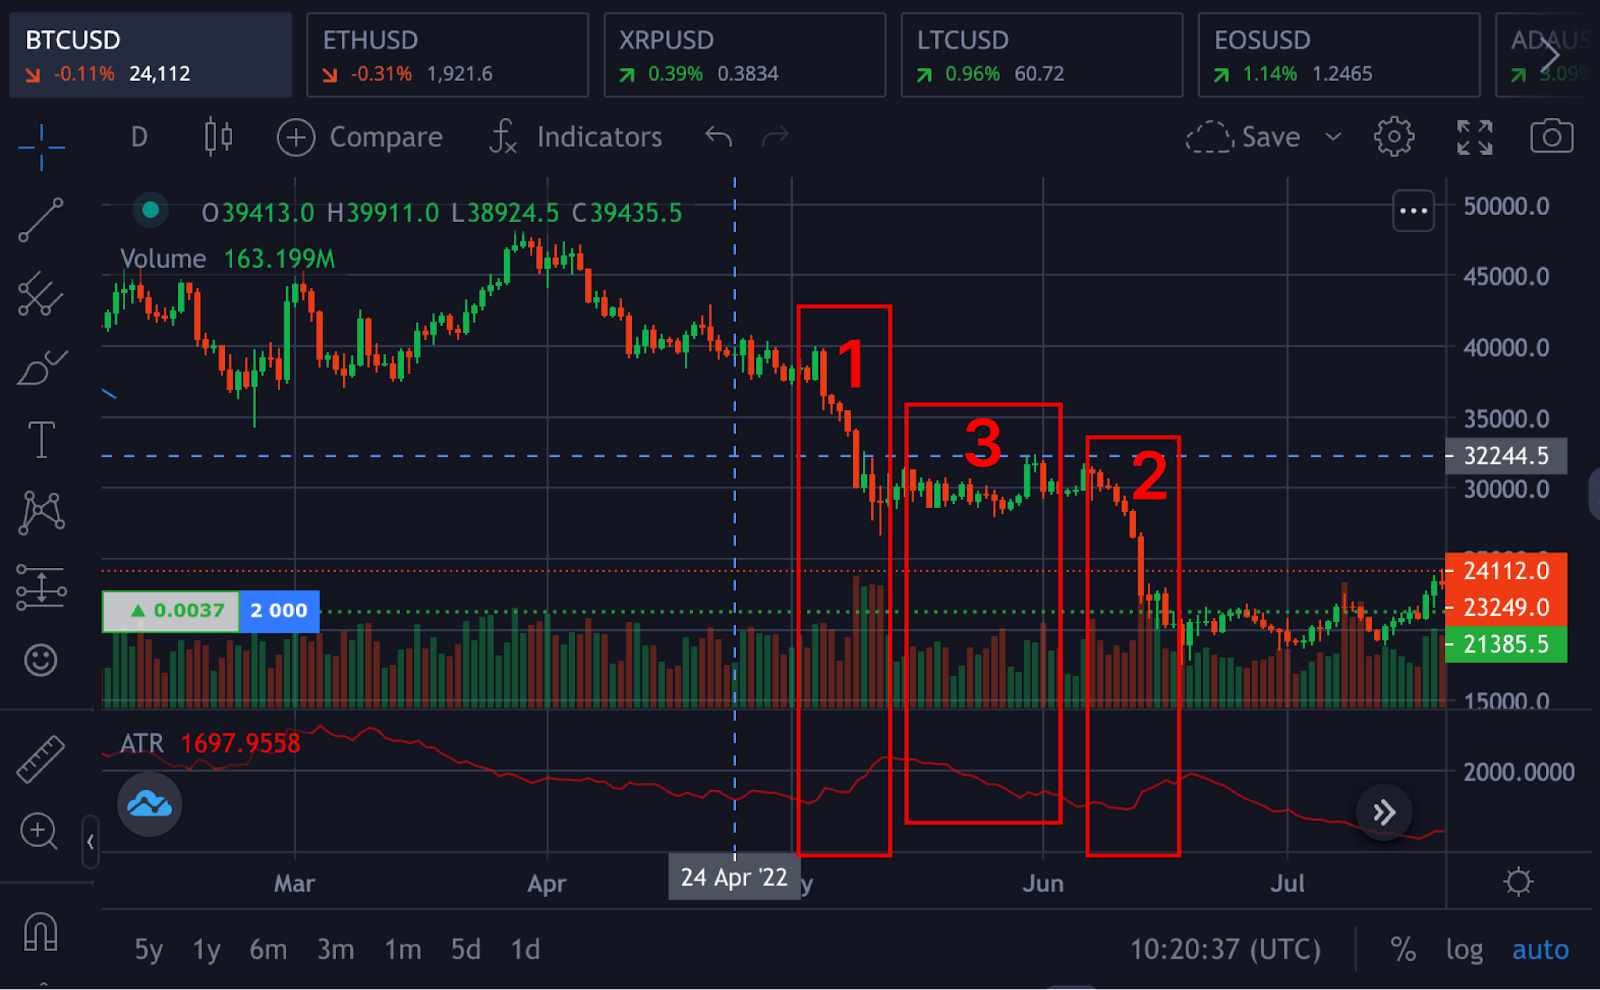
From the chart above, using Bitcoin and the united state dollar as the trading pairs (BTCUSD), you will notice the trend line is in a downtrend, and the trendline touches more than two points circled in red.
From the chart above, using Bitcoin and the united state dollar as the trading pairs (BTCUSD), you will notice the trend line is in a downtrend, and the trendline touches more than two points circled in red.
From the above chart, the downtrend line is acting as a resistance for the price and is a good opportunity for futures traders to enter a short position while setting their stop loss just a few distances from the trendline.
To draw trendlines effectively, you need to be aware of some important points from the trendlines drawn from the chart above.
Define Your Timeframe
A timeframe refers to the time at which a trend will last as identified by a trader.
There are different trends based on the timeframes, which are primary, intermediate, and short-term trends.
It is not new for novice traders to be locked on trading on the primary trends that correspond with a lower timeframe and miss out on riding the huge trends of the market.
Learning to use higher timeframes will lock so many gains and opportunities that this guide will focus on as a better trader.
Use The Higher Time Frames For Drawing Trend Lines
Most traders wonder which timeframe is best for better opportunities and to trade as a better trader; this depends on each trader's personality.
We will discuss the opportunities a higher timeframe has over a lower timeframe and how adapting to a higher timeframe will lock in so many gains, and you will become a better trader.
Lower timeframe - 1min chart to 30min chart
Higher timeframe - 1H chart to 1D chart
Trading on the low timeframe is not an idea for a novice or intermediate trader as this exposes them to price actions and uncontrolled losses.
A high timeframe has slow price movement; this gives the trader time to plan and execute the strategy, better control of emotions, and risk-to-reward opportunities.
Draw Trendlines That Connect At Least Two Major Swing Points
It's important to note that when drawing trendlines, you need your trendline to touch at least two swing points to establish a valid trend line for either upward or downward movement.
Before drawing your trend lines, always find the highest or lowest swing point for a start; this will make it easier to locate more points.
You don't expect to see swing points immediately when it calls for using higher time frames because they allow you to find these swing points with ease.
If your trendline does not touch two or more points, you should avoid assuming this is a trend line. Forcing trendlines usually leads to a trader amassing losses instead of spotting opportunities for gains.
Adjust To Get As Many Touches As Possible
When drawing trendlines, you should resolve to have at least two touches, as this will increase your chance of better trade setups and opportunities.
Sometimes getting more touches can be challenging. To achieve this, ensure you are on a higher time frame and then zoom out or step backward from the screen to better view your candlesticks. Doing this will help you discover swing points easily and draw your trendlines with confidence.
Trend Lines And Overlap
You must note that your trendlines drawn depend on the current market condition and the timeframe used. Market conditions could allow you to draw trendlines from swing highs to the next or from swing lows; what matters is you draw a trend line that gives a clear direction and opportunities in the market.
You must note that your trendlines drawn depend on the current market condition and the timeframe used. Market conditions could allow you to draw trendlines from swing highs to the next or from swing lows; what matters is you draw a trend line that gives a clear direction and opportunities in the market.
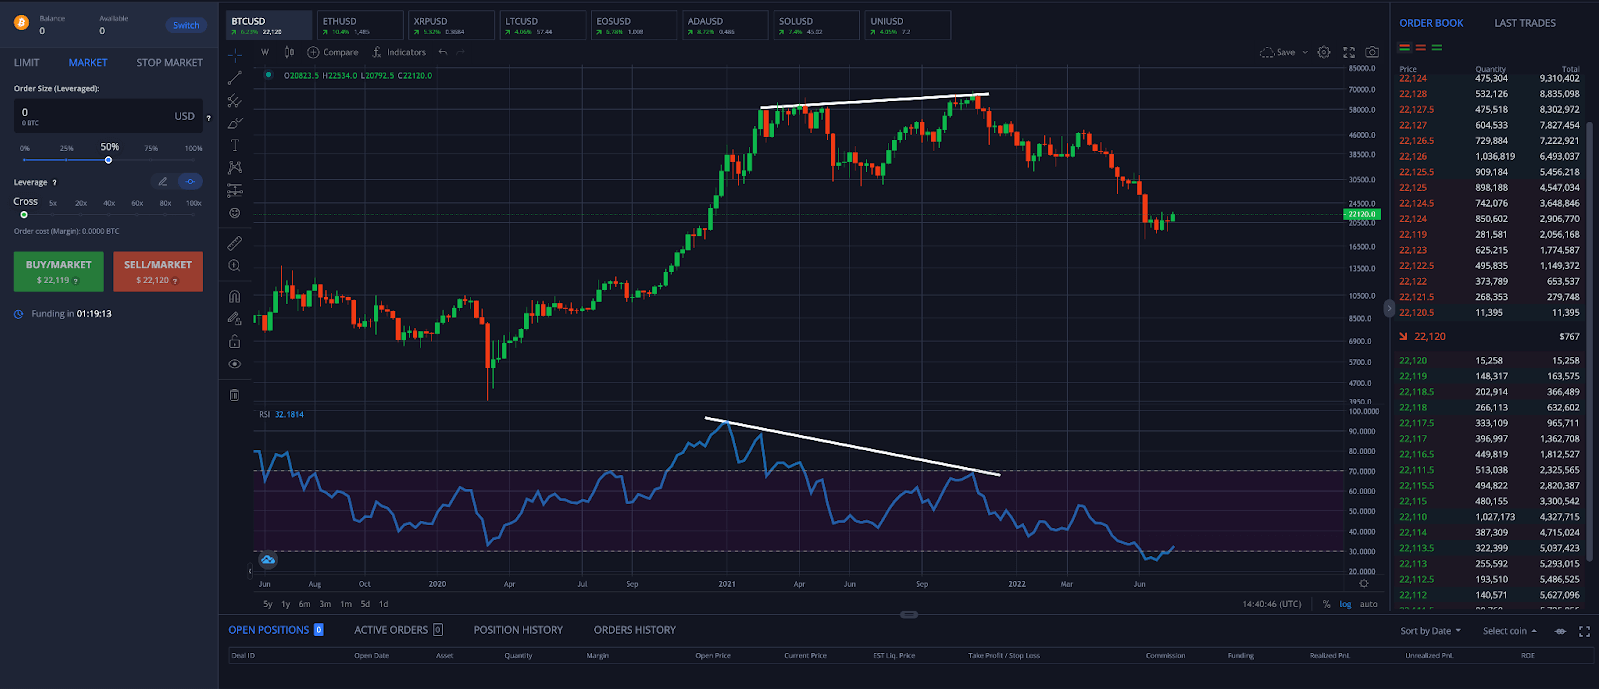
The chart above shows how the downtrend line touches three or more points, note as those points in circles have wicks of different lengths from the candlesticks. The overlap will happen as you draw trendlines; you don't have to force this trendline to fit in.
Never Try To Force A Trend Line To Fit
One of the mistakes most traders make is trying to force a trend line to fit to validate their setup. This is wrong; forcing a trend line will lead to much loss instead of helping the trader spot opportunities.
This is the same with drawing support and resistance; if a trend line does not fit, leave it to find a more suitable chart pattern.
How To Use Indicators To Draw Trendlines
We are a derivative platform that allows crypto traders to trade up to 100x leverage with various crypto assets.
Our platform is designed in such a way that the UI makes trading simple even for beginners, and some of the features include
To begin trading on our platform, you must first create new users and accounts, as well as verify your email address, to gain access to the UI page, where you can enjoy trading while existing users can do so by logging in.
Supposed you have a login to our platform; you will have access to their technical analysis tools built with real-time prices to make your trading worthwhile.
1. Trade - Click on trade at the top to access technical analysis tools where you can execute your trades seamlessly.
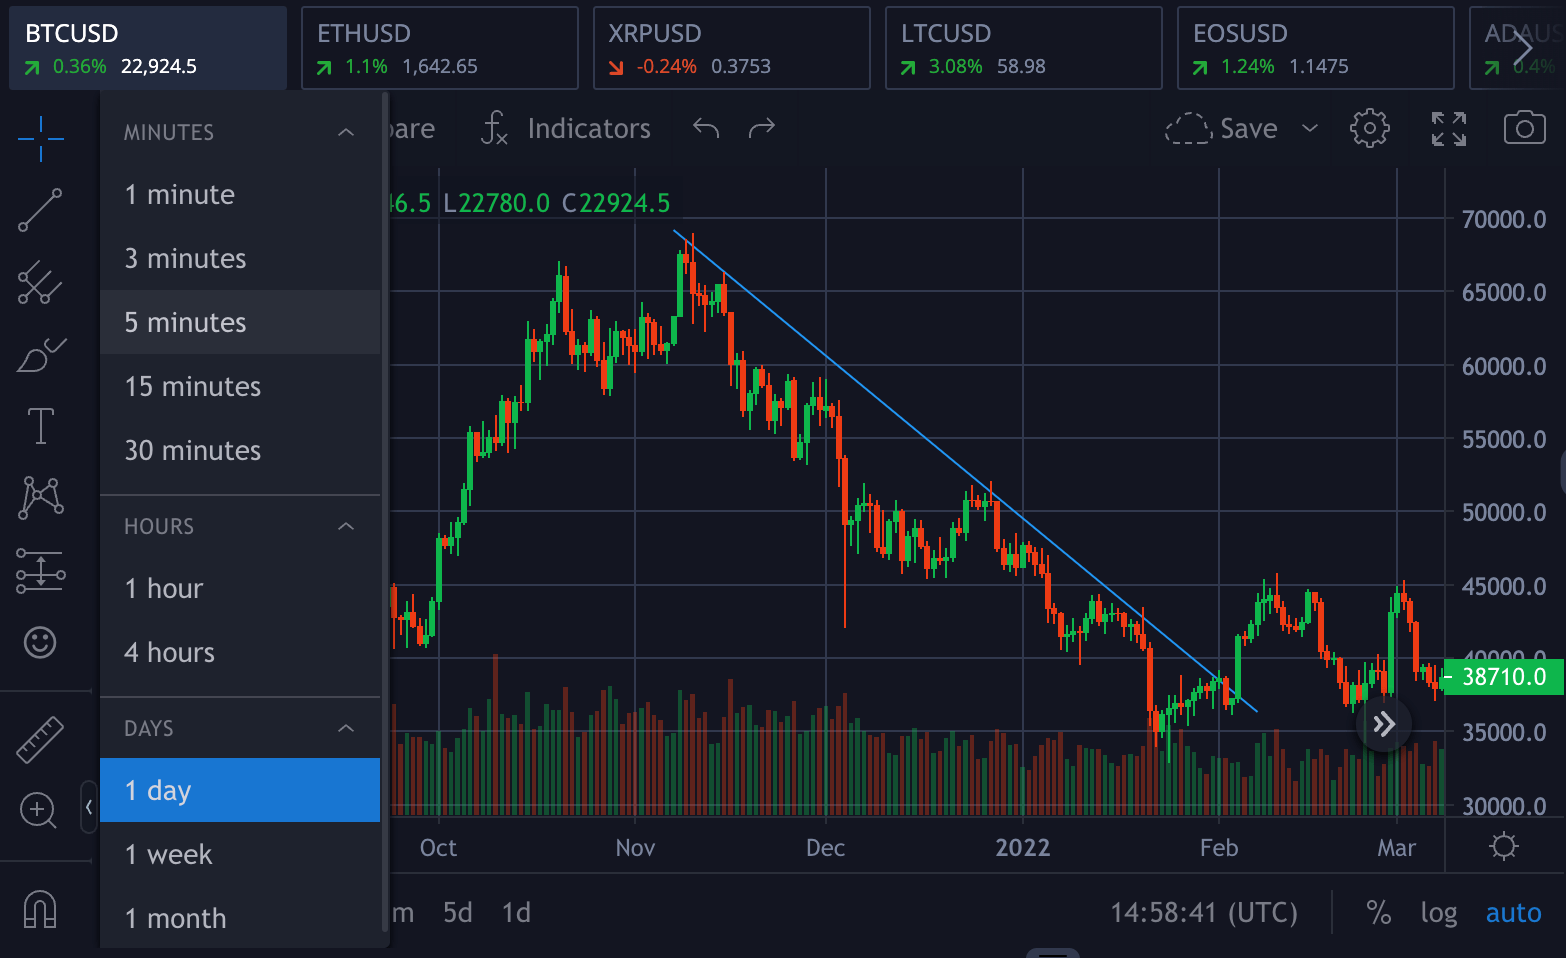
2. Timeframe - Click on the part labeled 2; it allows you to set the timeframe you wish to trade depending on your personality. You have the timeframe ranging from a one-minute chart to a one-month chart.
3. Candlestick - Clicking on the candles icon will allow you to change from a line chart to candles or whichever you prefer.
4. Indicators - Clicking on indicators, you will have access to use all indicators present on the platform free of charge. Click on an indicator, and it is added instantly. You can also search for your preferred indicator if you have a strategy in place to use.
5. Indicators - Tools for drawing on charts, drawing trend lines and channels, and using the Fibonacci retracements are found in this region.
With a good understanding of how to use our platform, click on trade, then pick candles on a high time frame of 1H to 1D. Zoom out the chart to spot swing highs or lows. Click on trends or tools to pick a trend line, click the highs or low to the next point and click.
You can drag the trend line if it is not positioned properly but do not force the trend line to fit in.